Join GitHub today
GitHub is home to over 20 million developers working together to host and review code, manage projects, and build software together.
Inconsistency between documentation and actual effect of the bar plot function #8327
Comments
|
This is a duplicate of #7954. |
 QuLogic
closed this
Mar 18, 2017
QuLogic
added the
Duplicate
label
Mar 18, 2017
Sign up for free
to join this conversation on GitHub.
Already have an account?
Sign in to comment
jdhao commentedMar 18, 2017
Bug report
Bug summary
There is an inconsistency between the matplotlib's documentation and actual outcome of the bar plot function. The documentation says that
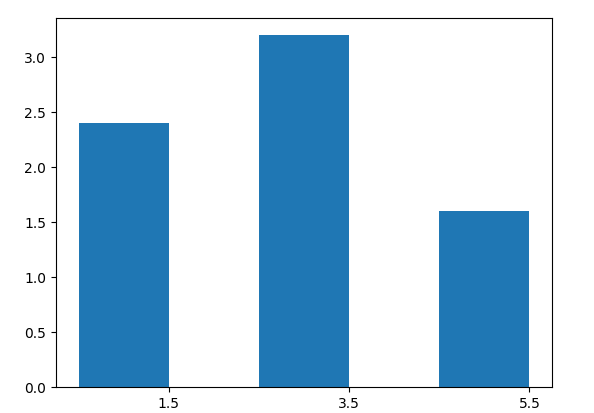
leftargument in the bar plot function indicateIn fact, the
leftparameter indicate the center of the bar.Code for reproduction
Actual outcome and expected outcome
The x axis ticks should be in the center of bar if the documentation is right. In fact, the ticks are in the right side of each bar. See figure below
Matplotlib version